
Consulting firms make some of the best presentations on data-heavy topics. We reviewed 55 publicly available decks and picked nine, with one interesting or representative slide from each.
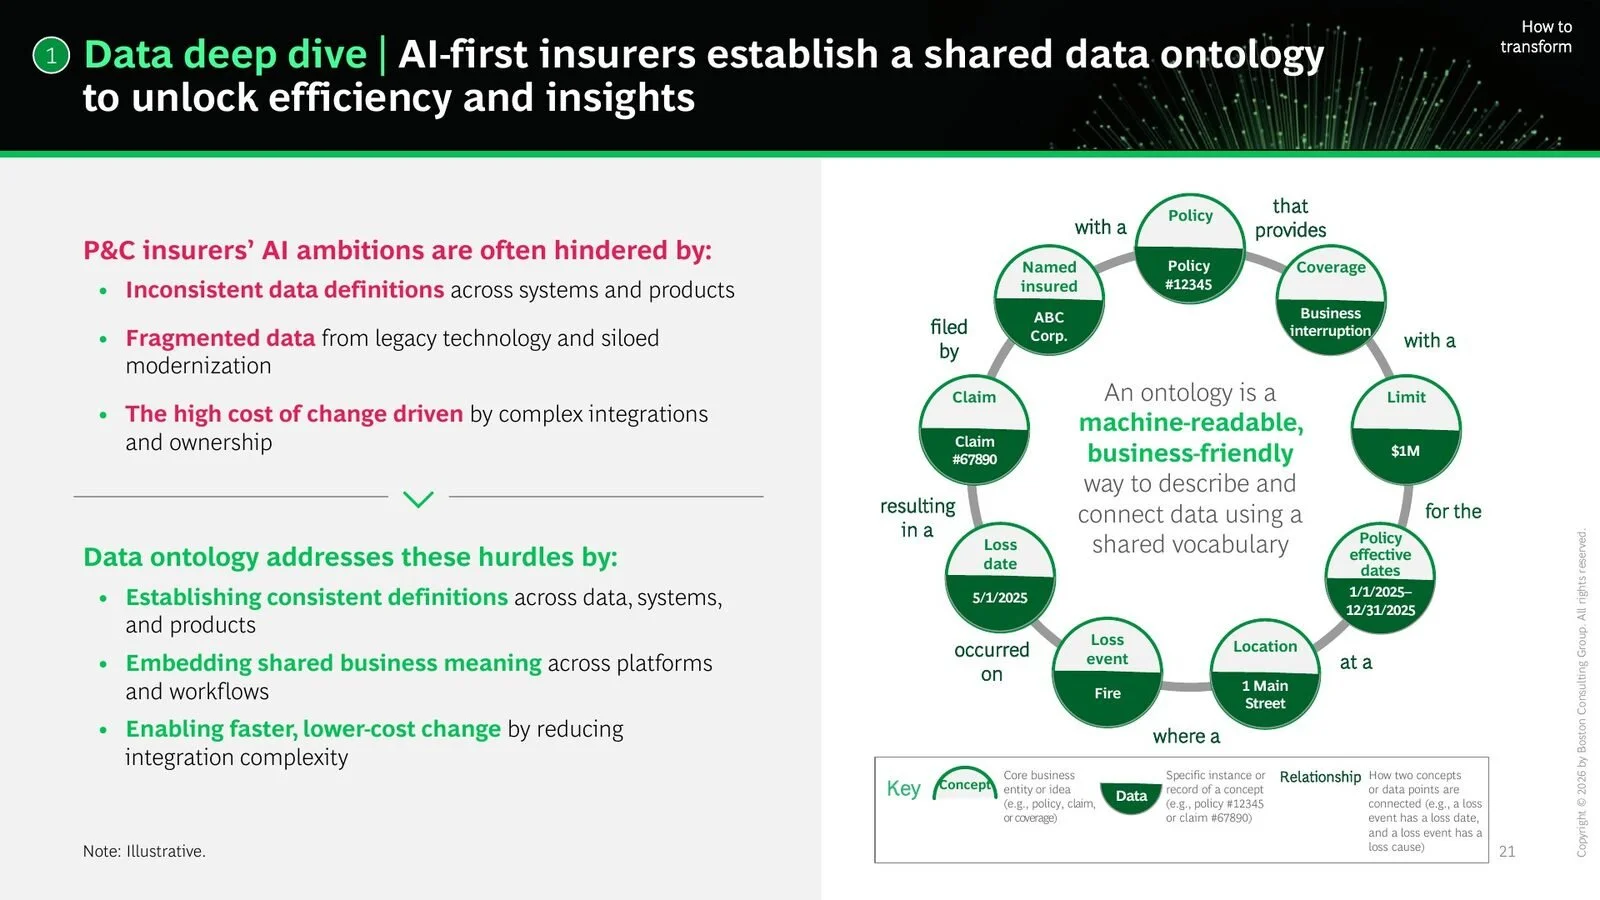
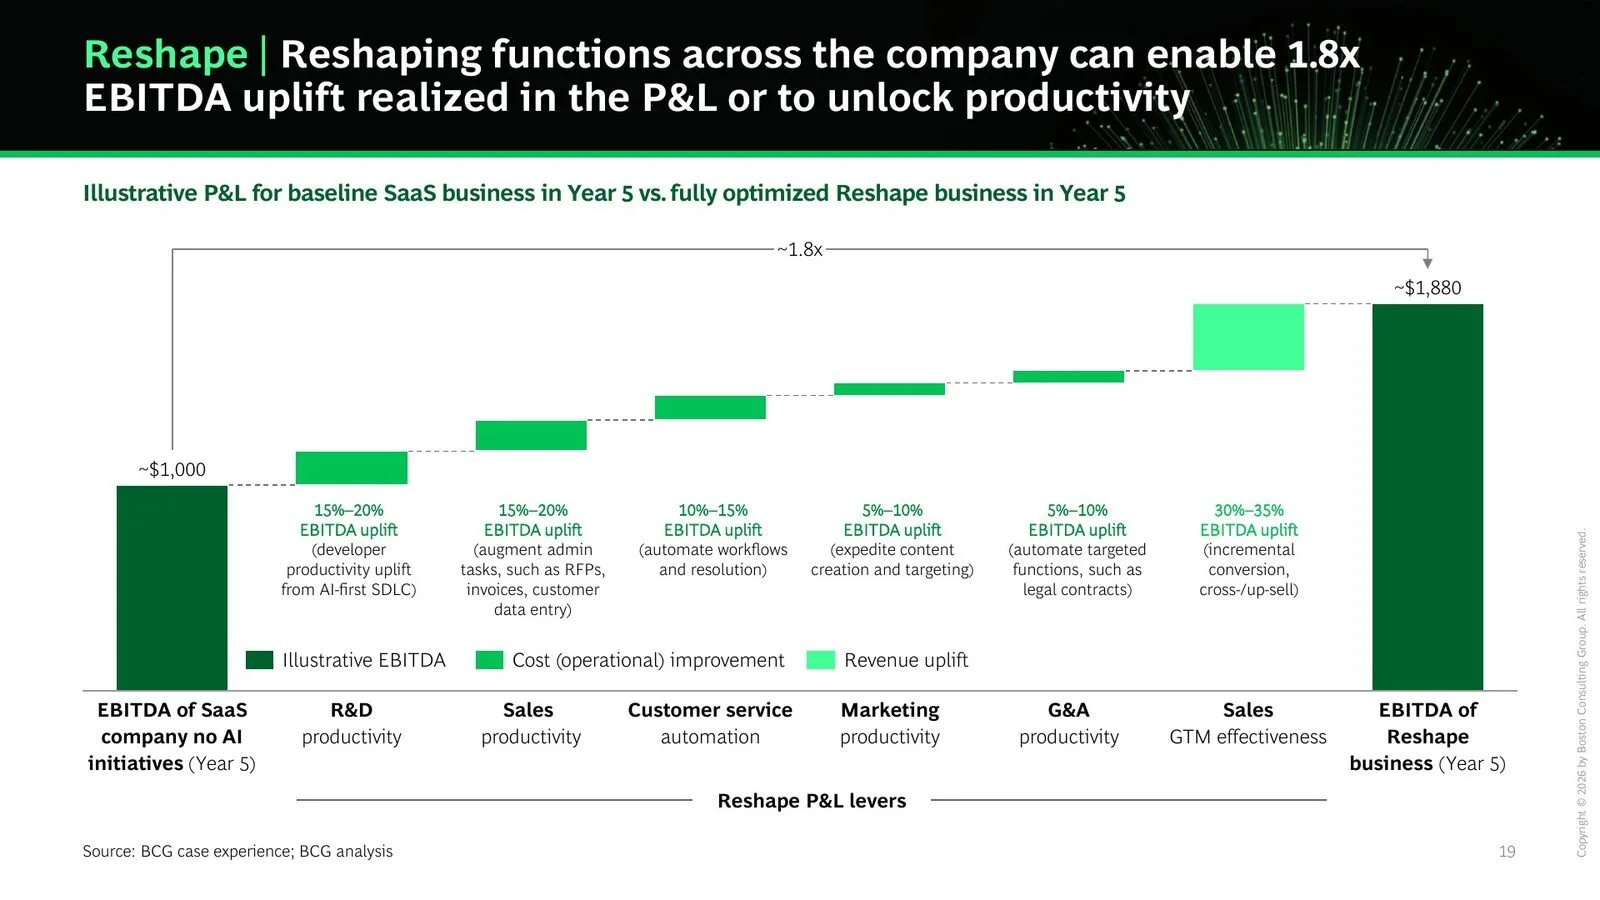
Not all of them are well designed. BCG's EBITDA waterfall labels each bar in type too small to read when presented, and BCG's insurance ontology diagram asks the reader to trace a dense web of labeled links. Slides by top consultants are good to learn from - what to do but also what to avoid doing.
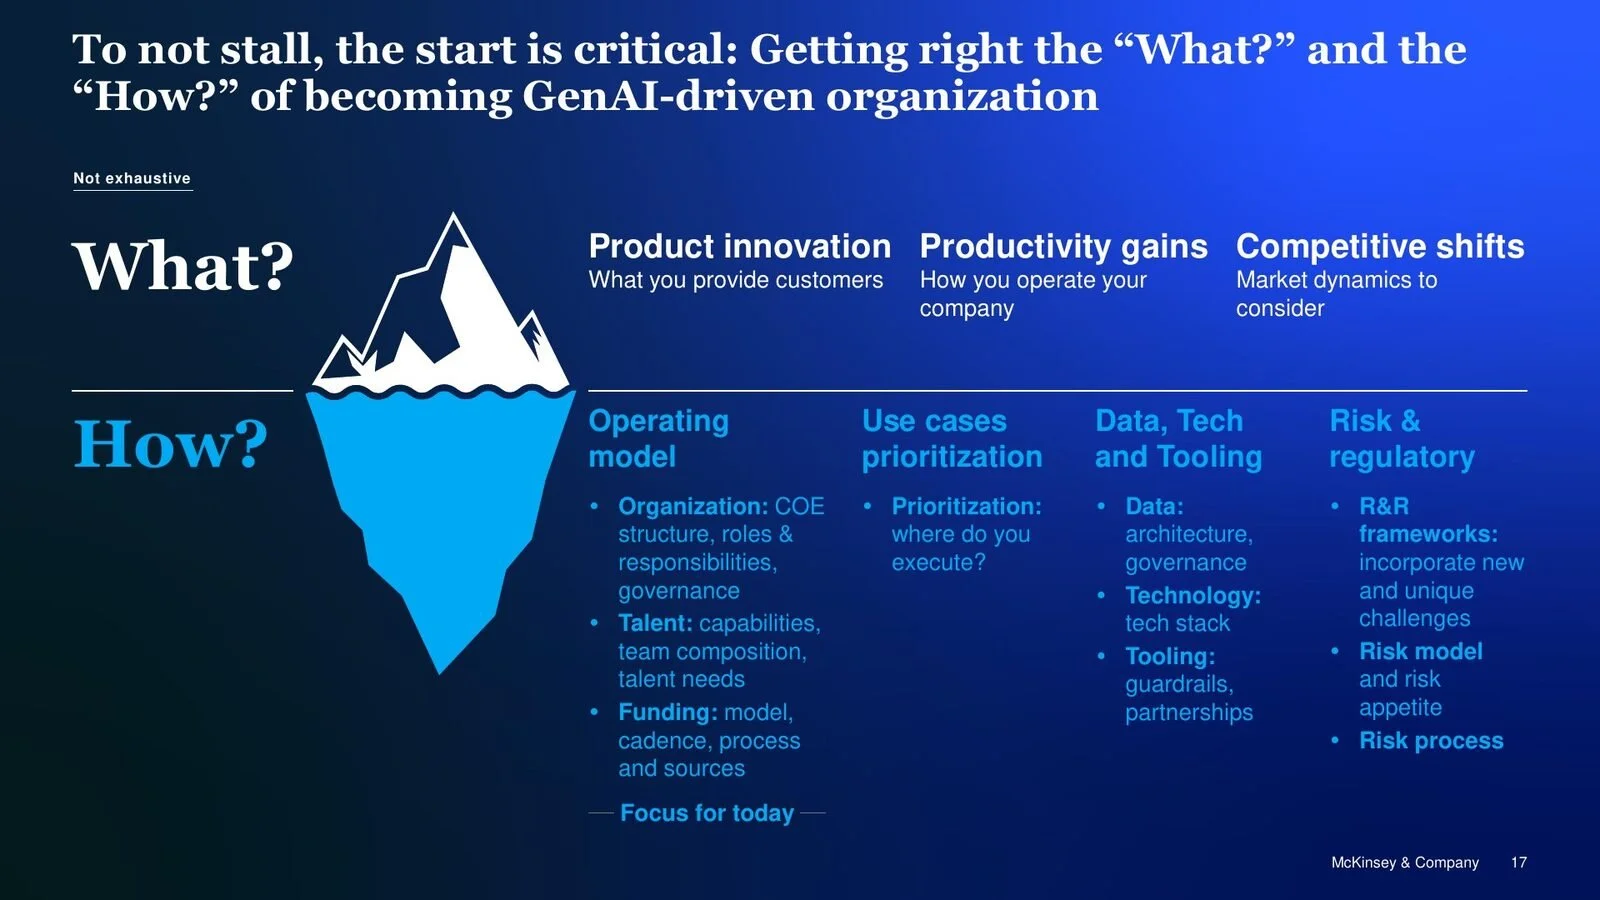
1. Creating Value with GenAI in Asset Management
McKinsey & Company
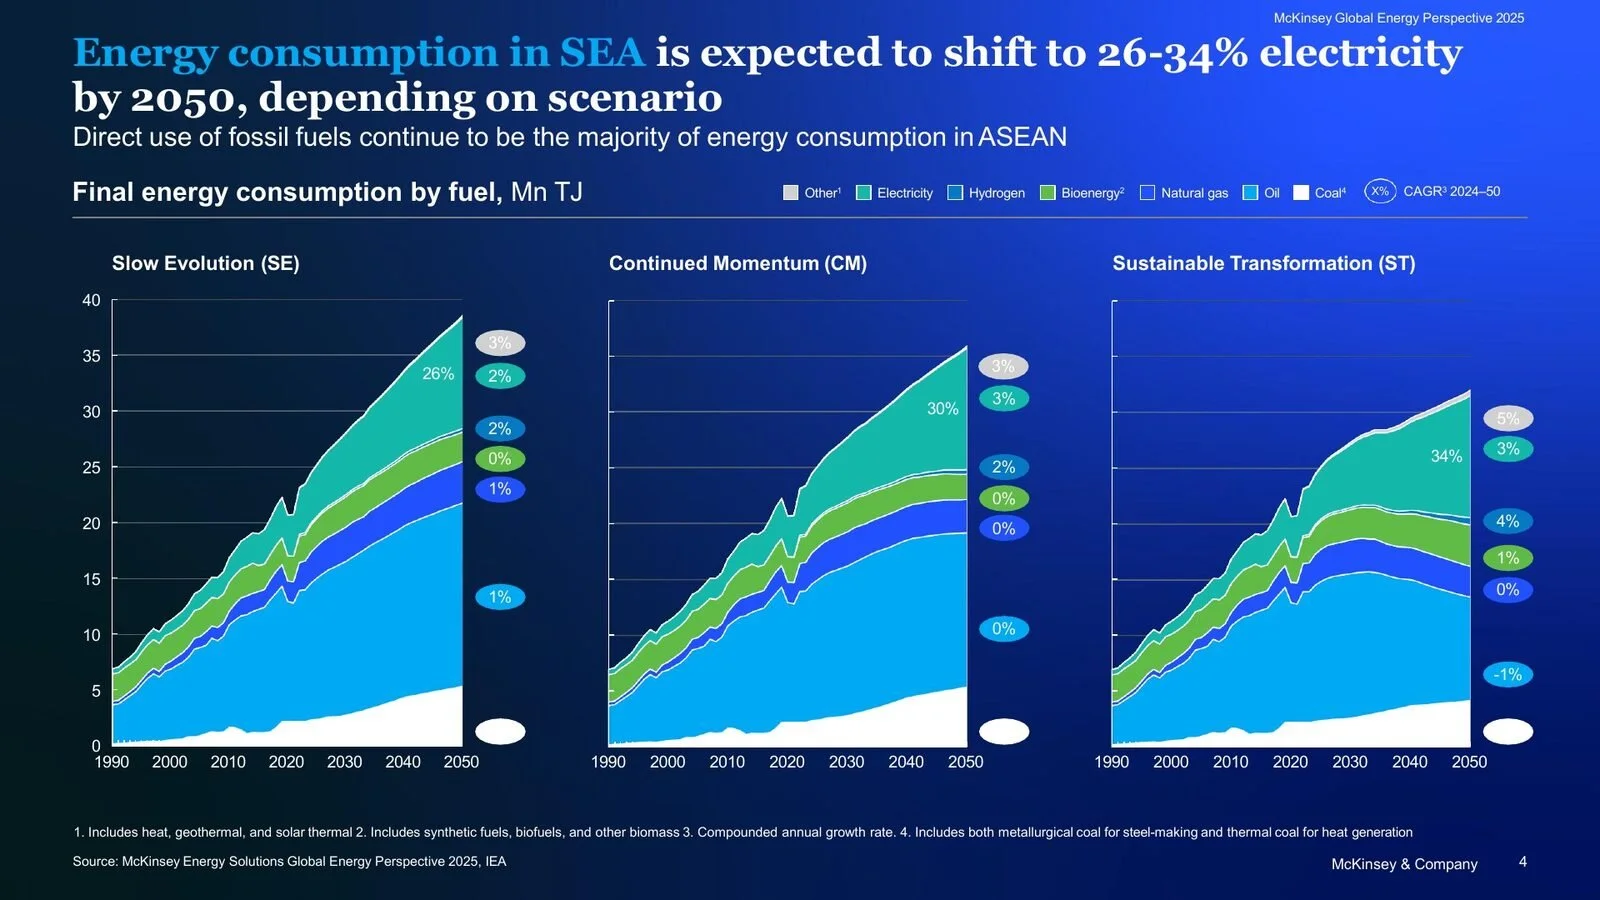
2. Global Energy Perspective 2025: South-East Asia
McKinsey & Company
3. AI-First Companies: Property and Casualty Insurance
Boston Consulting Group
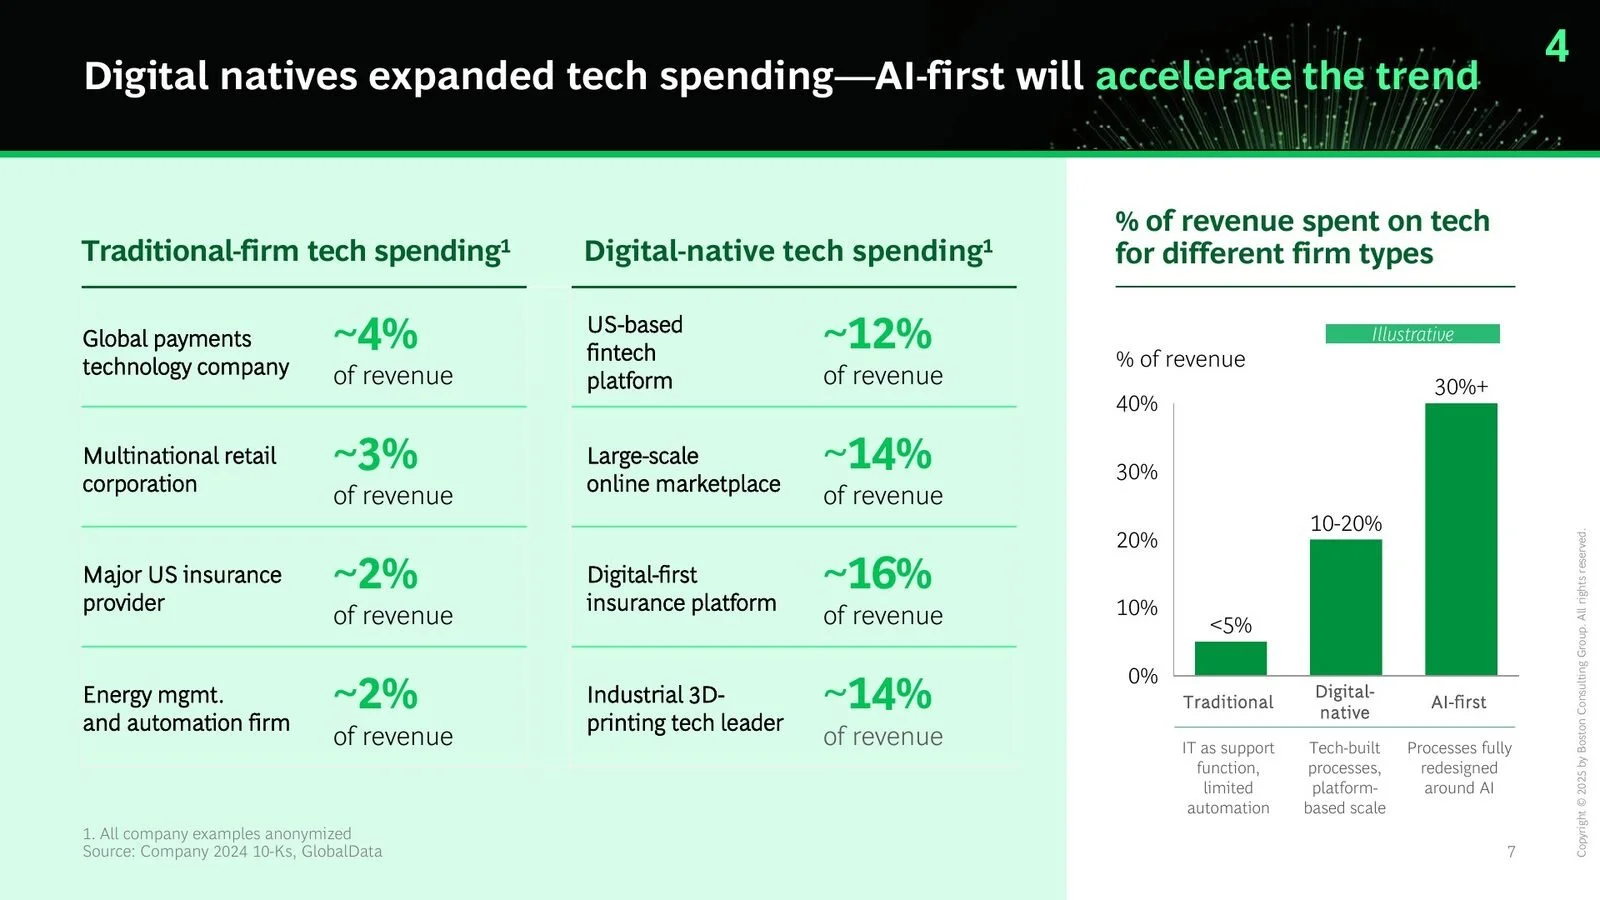
4. AI-First Companies Win the Future
Boston Consulting Group
5. AI and the Future of Software
Boston Consulting Group
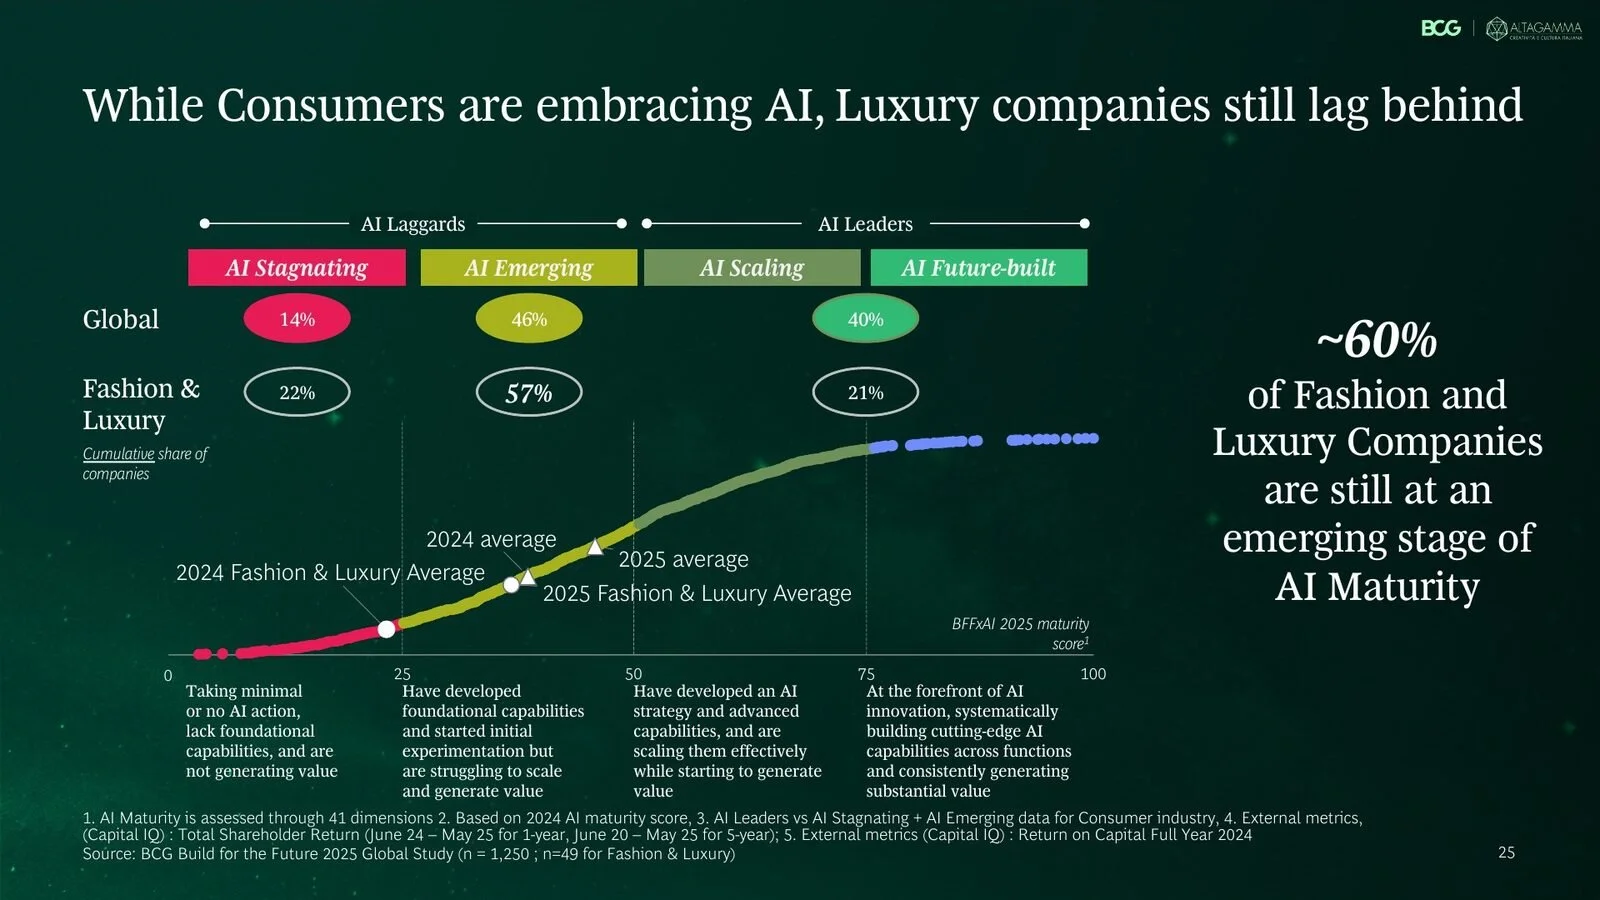
6. True-Luxury Global Consumer Insights 2026
Boston Consulting Group and Altagamma
7. Crafting AI for Luxury Real Estate
McKinsey & Company

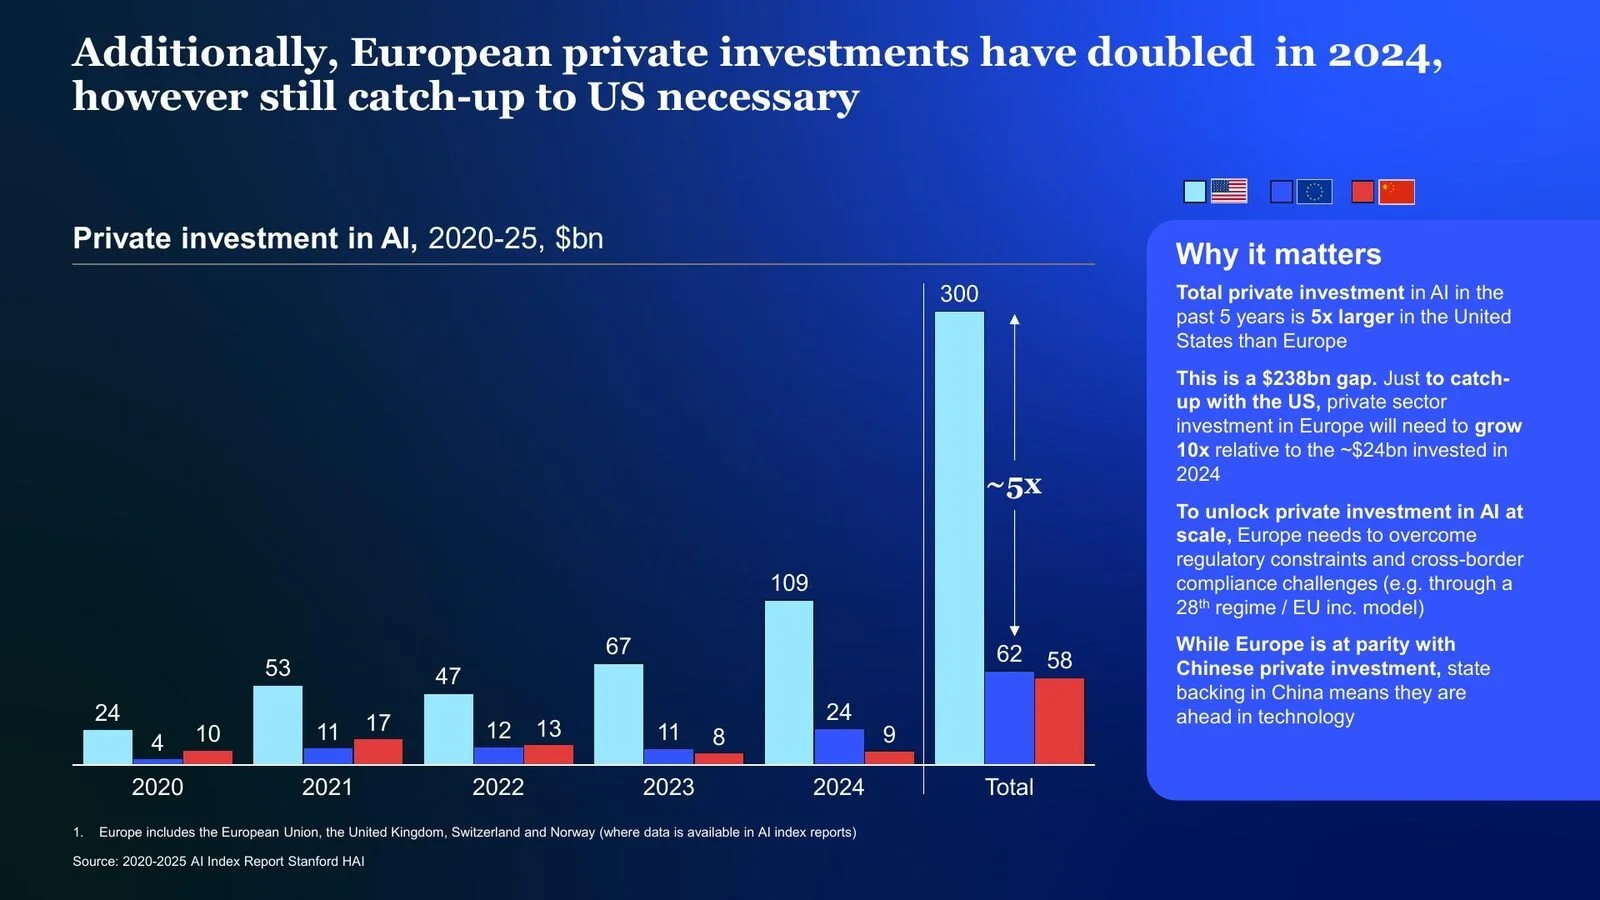
8. European Sovereign AI: Aspiration or Reality?
McKinsey & Company
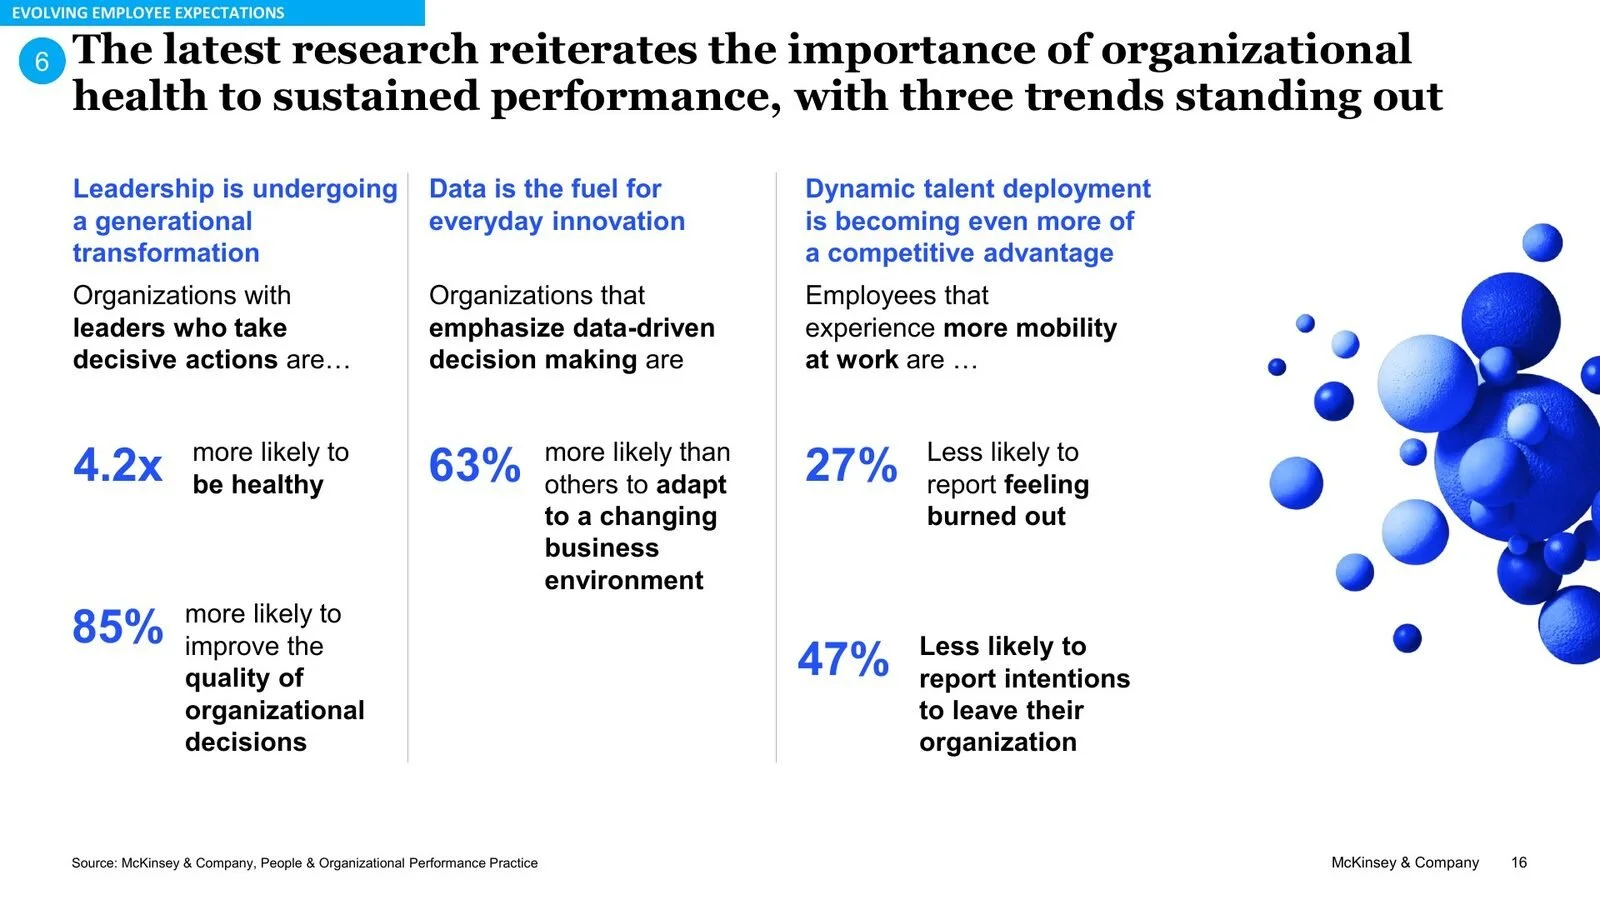
9. Navigating the Labor Market and Building Thriving Cultures
McKinsey & Company
Slides are reproduced for review and commentary. Copyright remains with the firms named. None of them is affiliated with Sliderefinery.
Want your own slides to look professional?
Book a call or email us.